
Table of Contents
Cost of Goods Sold, commonly referred to as COGS, is the sum of costs directly associated with producing the goods sold.
Any expense incurred that (1) is necessary to generate revenue and (2) directly impacts creating a sellable product must be included in COGS calculations. These costs can include materials as well as the staff required to assemble the materials into finished sellable goods.
See how Altitude Sports streamlined cost tracking and compliance.
Cost of Goods Sold with journal entry examples
In an e-commerce example, Zappos, an online shoe and clothing retailer would include these expenses in COGS:
- Materials to produce shoes
- Shipping cost of materials
- Parts or equipment used to produce shoes
- Cost of labor to produce shoes
- Cost of boxes and packaging to ship shoes to customers
Note: Customer shipping costs should not be part of COGS
When is COGS recognized
In accordance with the matching principle and accrual basis of accounting, COGS should be recorded in the same period as the revenue it generated. ASC 606 requires companies to apply the 5-step revenue recognition principle to transactions with customers and directs companies to recognize revenue when earned.
For e-commerce companies, both revenue and COGS must be recognized when the product has shipped. Doing so ensures accurate financial reporting and analysis.
However, recording COGS accurately can be complicated by variables such as shipping delays, returns, and missing vendor invoices – just to name a few. In certain scenarios such as when sales impact multiple periods, recording COGS in the appropriate period can be difficult due to system limitations. We dive deeper into these technology challenges in this blog post.

COGS Journal Entry Examples
Suppose Zappos sold a pair of shoes in June for $100. The total cost of producing the shoes is $60. The company will record the following journal entries in June:
| Account | DR | CR |
|---|---|---|
| Cash | $100 | |
| Revenue | $100 |
To record sales revenue from shoes.
| Account | DR | CR |
|---|---|---|
| Cost of Goods Sold (COGS) | $60 | |
| Inventory | $60 |
To record COGS for shoe revenue.
In certain situations, sales can impact multiple periods. An order of $50 is placed on Jan 31 but not shipped until Feb 2. While the company won’t recognize revenue until the product is shipped, they must accrue the revenue in the current period (and therefore, COGS as well). COGS accrual can be calculated as either a percentage of sales or based on historical costs of similar transactions. In this example, we can assume COGS is 60% of sales. The accounting team should book the following journal entries:
| Account | DR | CR |
|---|---|---|
| Accounts Receivable | $50 | |
| Revenue | $50 |
To record accrued revenue from order.
| Account | DR | CR |
|---|---|---|
| Cost of Goods Sold (COGS) | $30 | |
| Inventory | $30 |
To record COGS for shoe revenue.
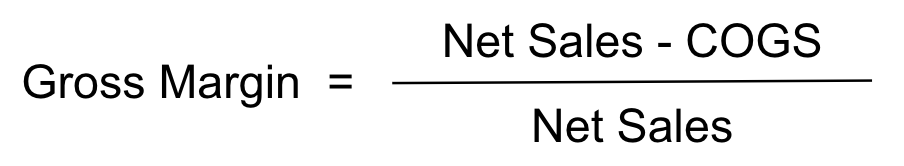
Gross Margin Calculation
Gross margin is the percentage of revenue that exceeds a company’s Costs of Goods Sold, calculated using the formula below.
Gross margin is an important metric that often involves operations, procurement, supply chain, and sales teams because of the significant impact of COGS on a company’s performance. In addition, gross margin and COGS analysis inform companies how to maximize revenue or generate more cash.
For example, if improving gross margin is a key company initiative, the procurement team should negotiate more favorable terms with vendors to realize cash savings. The controller may also inquire with supply chain personnel regarding the timing of shipping orders to customers, which impacts COGS.
In example above, Zappos has a 40% gross margin. Based on this metric, a controller or other key finance team member can provide commentary on business performance:
While our 40% margin is standard for our industry, our competitors are outperforming us with 50%+ margins on similar products. We know that there is consumer demand so how do we improve our margins? Should we increase marketing efforts and focus on pushing higher-margin products? We’re getting better rates from our vendors so what if we promote the newer arrivals first so that we can sell the products with the lower cost first (assuming a FIFO inventory method)? Let’s chat with marketing regarding new campaigns and with supply chain to ensure we can handle the added shipping volume without excessive delays in light of the pandemic.
COGS vs. Operating Expenses
An important distinction to note is the difference between COGS and operating expenses (commonly referred to as OpEx). In the Zappos example, while the factory machinery is part of COGS, the electricity, factory supervisor’s salary, and rent are not. While these costs are incurred to generate revenue, they are indirect costs that don’t involve the product itself.
Where COGS gets tricky
Calculating COGS can get very complicated if you’re relying on manual spreadsheets and disparate sources of data. That’s because accounting for COGS invovles reversals that are very hard to track without having all your finance data in one central place. As Leapfin’s Architect Jason Berwanger explains in this video:
Conclusion
Cost of Goods Sold is one of the most scrutinized metrics in finance. COGS provides visibility into the efforts and costs required to generate revenue. Accurate and real-time reporting of COGS as critical as it informs pricing, efficiency, and business strategy. And that becomes much more streamlined with a single source of truth that can help you analyze all your transactions on a granular level. This is where Leapfin can come in very handy.
As Jason puts it:
With Leapfin, you can book the actuals directly to your ledger. Our finance data platform has made it easy to offset reversals without having to pull data from disparate data sources. And you can see all of the onsets and offsets of a single customer or a single record all in one place, which is not the case for most companies.
Companies are usually working with a bunch of different Excel sheets that have aggregated data where the atomic or transactional data can’t be stitched back together because that level of detail becomes lost. Thereby, explaining what’s the difference now means recreating various events at a transactional level to try to tie it together. But that’s not easy.
The biggest problem is is everything’s changed since then. At the time you closed the books, when something wasn’t paid, it may be paid now. So you do the analysis and then you now have a dilemma. What is the truth now? What was the truth at the time I closed the books? And then what was it last month? You’re trying to juxtapose all the three things and that’s next to impossible.
See how Leapfin works
Get a feel for the ease and power of Leapfin with our interactive demo.